EURJPY SMC Outlook for London Session
Market Overview
Daily Chart – Institutional Structure
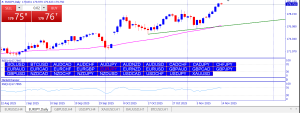
- Trend: Dominant uptrend with higher highs/lows.
- Current Price: ~179.75
- 200 EMA: Below price near 176.50 (bullish control)
- RSI (14): 67.8 – bullish, nearing overbought.
Observation: Systematic buy-side liquidity sweeps above prior highs place the 179.90–180.20 region as a likely rebalancing zone before Smart Money corrects to collect sell-side liquidity.
Daily Bias: Bullish continuation overall; mild retracement expected.
H4 Timeframe – Liquidity Flow
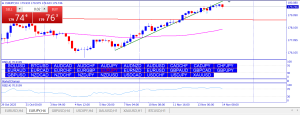
- Momentum: Strong; price tracks an ascending support line.
- Liquidity Event: Buy-side liquidity taken above 179.90–180.00.
- Expectation: Controlled pullback into 179.00–178.80 to mitigate inefficiencies.
H4 Bias: Buy-side sweep → retracement → bullish continuation.
H1 Chart – Intraday Structure
- Order Flow: Micro-BOS near 179.75 signals short-term correction.
- Key Zones: Bearish OB 179.85–180.05; Bullish OB 179.00–179.25.
- EMA Alignment: 50 EMA near 179.20 reinforces buy zone.
H1 Bias: Correction to discount zones before resuming long trend.
Lower Timeframes (M30–M15)
- Rejection: Bearish engulfing near 179.90 following buy-side sweep.
- FVG: 179.30–179.55 likely magnet for rebalancing.
- RSI: Mid-40s to low-50s; momentum cooling.
Lower-TF Bias: Short-term sell-side retracement inside macro bullish delivery.
High-Probability Trade Plans
1) Intraday Short Setup
| Bias | Sell-side retracement |
|---|---|
| Entry Zone | 179.80–180.00 (bearish OB + liquidity sweep) |
| Trigger | Bearish engulfing/rejection candle on M15–M30 |
| Targets | TP1: 179.45 → TP2: 179.20 → TP3: 179.00 |
| Stop Loss | Above 180.20 |
| Note | Tactical short during retracement before bullish re-entry. |
2) Swing Long Setup
| Bias | Bullish continuation post retracement |
|---|---|
| Entry Zone | 178.90–179.20 (discount OB) |
| Trigger | Bulllish reversal or FVG fill confirmation on M30–H1 |
| Targets | TP1: 180.00 → TP2: 180.80 → TP3: 181.50 |
| Stop Loss | Below 178.60 |
| Rationale | Smart Money likely to re-accumulate at discount pricing. |
Liquidity Roadmap
| Zone | Type | Expectation |
|---|---|---|
| 179.90–180.10 | Buy-side Liquidity (Swept) | Distribution / Sell reaction area |
| 179.20–179.00 | Sell-side Liquidity (Untapped) | Re-accumulation / Discount zone |
| 178.80–178.60 | Institutional Repricing Area | Deep discount for swing entries |
Invalidation Levels
- Below 178.60: Suggests distribution rather than continuation.
- Strong H4 close above 180.20: Invalidates intraday sell bias; confirms immediate bullish expansion.
Institutional Narrative
After a textbook liquidity grab above 180.00, Smart Money is expected to drive price lower to rebalance inefficiencies near 179.00 before initiating the next bullish leg. This phase represents a buy-to-sell-to-buy delivery model — engineered to trap breakout traders and reload institutional long positions at discount. If confirmed, the next bullish expansion phase should target 180.80–181.50 in the coming sessions.
Session Summary
| Timeframe | Bias | Key Zone | Institutional Action |
|---|---|---|---|
| Daily | Bullish | 178.80–179.00 | Accumulation / Continuation |
| H4 | Retracement | 179.00 Demand | Rebalance / Re-accumulation |
| H1 | Corrective | 179.80 Supply → 179.20 Demand | Controlled pullback |
| M15–M30 | Bearish retracement | 179.85–180.00 | Tactical intraday short setup |
All TPS Checked for both Intraday and Swing Trading Signals.