EURUSD London Session Brief: Aligning with Smart Money for a High-Probability Buy
Date: November 10, 2025 Time: 10:03 AM (WAT) / 09:03 (GMT) Bias: Bullish Signal: EURUSD Long
Good morning, traders. The London session is in full swing, and our desk is focused on one high-probability setup: EURUSD Long.
The macro environment and the technical price action are in perfect alignment, which is a rare and powerful combination. Smart Money is clearly showing its hand, and our job is to trade in line with that flow.
Here is our complete institutional breakdown and actionable trade signal.
🏦 The Big Picture: Why Smart Money is Bullish on EUR
The primary driver for our bias isn’t on the charts; it’s the fundamental monetary policy divergence between the ECB and the Fed.
- The Fed (USD – Weak): The U.S. Federal Reserve is in a dovish pivot. They cut rates in October for the second time. More importantly, recent private-sector data (the Challenger report) revealed that job cuts have surged to a 20-year high. With the U.S. government shutdown withholding official data, the Fed is being forced to react to this weakening private data. As a result, the market is aggressively pricing in another rate cut in December. This is putting significant, sustained pressure on the U.S. Dollar.
- The ECB (EUR – Strong): In contrast, the European Central Bank is holding firm. Inflation is stable around their 2% target, and ECB board members have communicated confidence. The market has no reason to expect rate cuts from the ECB.
Conclusion: Institutional (Smart Money) flow is moving out of a weakening U.S. Dollar and into a stable Euro. This gives us a clear, high-level bullish bias for EURUSD.
📈 The Charts: Reading the Smart Money Footprints
Now, we look at the charts to confirm this bias and find our entry. We use a top-down, multi-timeframe approach.
Higher Timeframe (HTF) Dominance (Weekly/Daily)
- Daily Chart: We have a significant Break of Structure (BOS). The price has decisively broken and closed above a multi-week bearish trendline (see the red line on the Daily chart). This is a clear shift in momentum, indicating sellers have lost control.
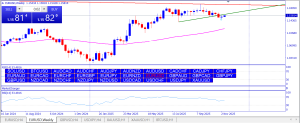
- Weekly Chart: On the Weekly, this bullish move is coming after a strong rejection (a long wick) off a major ascending trendline (demand line). Long-term buyers have clearly defended this level.
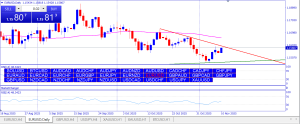
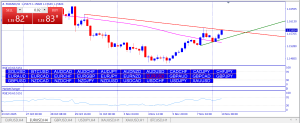
Entry Timeframe Confirmation (H4/H1)
- H4 Chart: This chart shows a classic “break-and-retest.” Price broke above the 200-period SMA (pink line), pulled back to retest it as new support, and has now bounced hard. This confirms the shift from resistance to support.
- H1 Chart: The H1 chart shows a clean, bullish order flow (Higher Highs and Higher Lows). The small dip we saw around 09:00 (chart time) was a classic liquidity grab, sweeping sell-side liquidity below the 200 SMA before the real move. This has established a fresh H1 Order Block (OB) around 1.1550.
Current State (M5/M15)
The M5 and M15 charts show we are in a strong expansion (impulse) phase. The candles are large and bullish (blue), showing that buy-side algorithms are in full control.
🎯 EURUSD Trade Signal (London Session)
Given the total alignment of bullish fundamentals, bullish HTF structure, and bullish LTF order flow, we are only looking for buys.
Signal: EURUSD LONG (BUY)
- Entry: This is a patient entry. We are in an impulse, so we wait for a slight pullback to a fresh area of demand. We are looking to enter at the M15 Fair Value Gap (FVG) / Order Block created during this morning’s move.
- Entry Zone: 1.1575 – 1.1565
- Stop Loss (Invalidation): 1.1545
- (This is placed just below the last significant M30 low. A break of this level would invalidate the current bullish structure).
- Target 1 (TP1): 1.1655 (Recent H4 High / Major Liquidity Pool)
- Target 2 (TP2): 1.1690 (The Daily 200-period SMA, which will act as a strong magnet)
This is a high-probability A+ setup for our desk. We are simply following the institutional footprint.
Trade safe, and manage your risk.